
Dashboards
Every project's numbers, on one page.
Revenue, costs, usage, health and what's due, for the whole portfolio and for each project. Every figure says where it came from and how far it is complete.
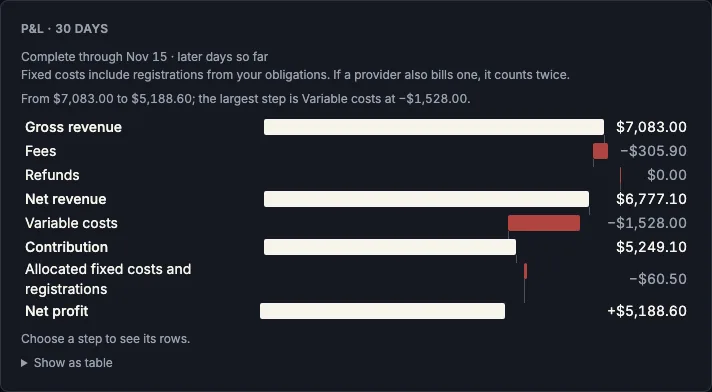
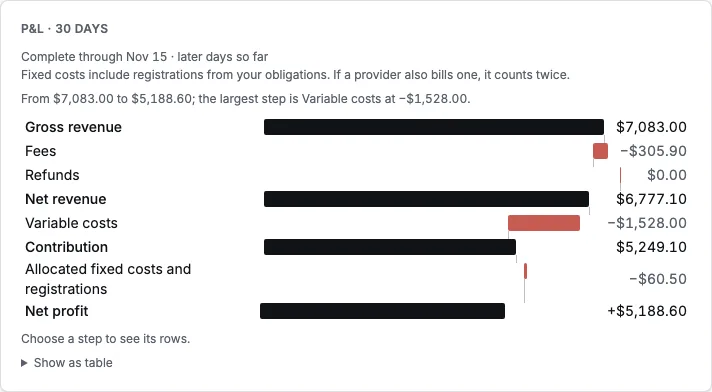
Profit per project
Gross revenue, then fees, refunds, variable costs and each project's share of fixed costs, down to net profit. MRR, ARR, churn and what moved them sit beside it.
- Revenue from Stripe, Paddle, the app stores and four more.
- A cost shared by several projects is split by a rule you choose.
- An open-source or public-good project shows its cost to run.
Health, one row per project
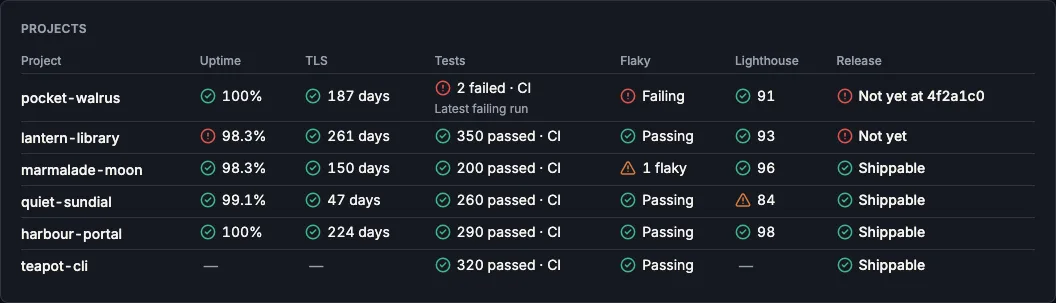
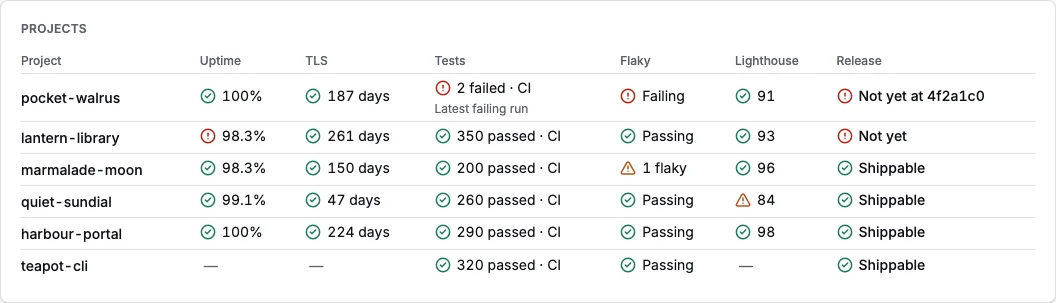
Uptime, TLS, CI, flaky tests, Lighthouse and the release verdict for every project, with incidents and a 90-day uptime strip under them.
- Uptime and certificate checks need nothing authorised.
- Flaky tests are counted apart from failing ones.
- CI on main from GitHub, with each workflow's last 30 runs.
What's due
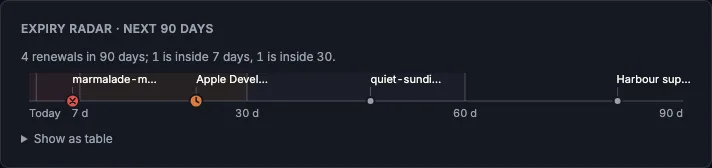
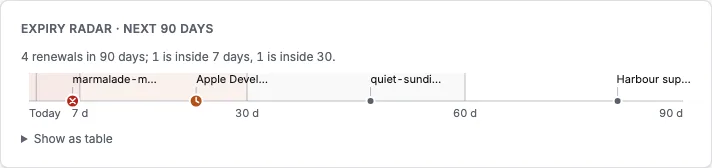
Domains, certificates, memberships and renewals on a 90-day radar, with what each costs. ShipVitals reminds you before each date, and your calendar can subscribe to the same list.
- Domain registrations and certificates are watched for you, with nothing to authorise.
- Anything else with a date is one form: a key, a membership, a contract.
Also in ShipVitals
Costs and budgets
What each project costs by provider and service, a month-end forecast from the last seven complete days, the biggest change, and a budget per project.
- Each line is labelled API, estimate, invoice or manual.
- No API? Forward the invoice and it becomes a cost line.
- Budget and spend-anomaly alerts are on from the start.
Usage
Active users from GA4, Plausible, PostHog, Fathom or Umami, downloads from npm, PyPI, crates.io, Docker Hub and Homebrew, or a metric your own server pushes.
Numbers you can check
Every card opens Explain: the formula with the actual numbers in it, the sources behind it and the date each is complete through. A partial or stale figure says so on the card.
Who sees what
Owner, admin, editor and viewer, with editors and viewers limited to some projects if you like. Amounts can be hidden from them, and the database enforces it.